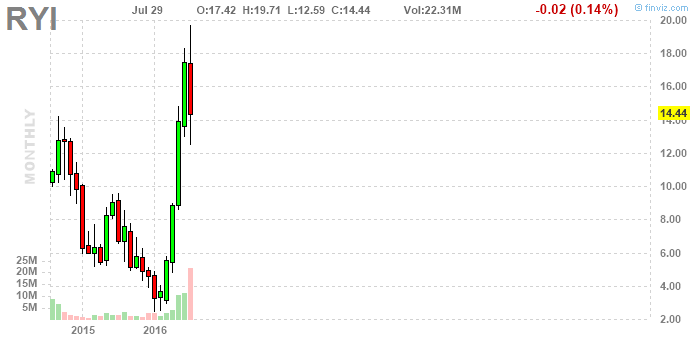
Evidence that stocks can and do go up.
 *
*
Click the star for links to additional information. Click the chart to view it full size.
Choosing the *m link, then looking at the "financials" ... Dec. 2015 annual report ... $3B in sales and a $500K loss. Current assets: $1B, total liabilities: $1.7B, current liabilities: $315M. Checklist: Big: yes; Profitable: no. Size of loss: small; Profitable prior years: mixed / yes; Book value: no; current ratio: strong / yes; Marked down: yes = down 50% in 6 months.
No comments:
Post a Comment